The program of bandpass filtration is intended for filtration and spectra visualization of input modification traces. Except for bandpass filtration the program can be applied for filtration of high frequencies (FHF), filtration of low frequencies (FLF) and rejector filtration. The operator of the filter can be zero-phase and minimal-phase.
In a mode of zero - phase filtration the given weight function of the filter (the spectrum of the filter operator) is directly used for convolution (complex multiplication of spectra in frequency domain).
In a mode of minimal - phase filtration the program on the given spectrum of the two-sided operator of the zero - phase filter calculates a complex spectrum of the unilateral operator of the minimal - phase filter.
The results obtained by the given program, can be used at any stage of processing, any programs of a package UNIVERS.
The given program is interactive, i.e. the continuous management by the user of a course of program carrying out is realized. At once after start of the program before the user there is a window of traces visualization.
The name of the project and name of modification, which be subject to
processing is selected of menu item File - >
Open, then in a field of visualization of traces the selected
modification is drawn.
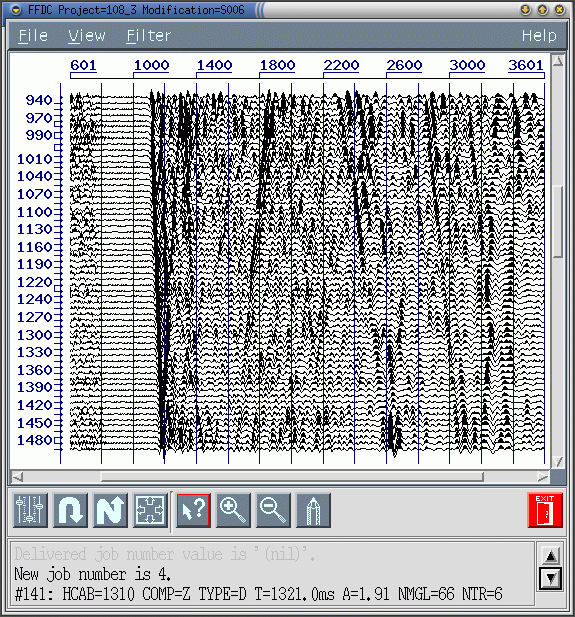
Further in the menu item Filter or in a scale of
tools located under a visualization field, the button of an input in a mode " the definition of weight function " is selected,  .
.
Is opened the panel Band-Pass Filter Parameters,

intended for numerical definition of the weight characteristic of a filter in frequency domain in four nodes. In each node the characteristic the frequency and value, appropriate to it of a weight < 1 is set. On two nodes are preselected to default. These points have frequency rates and amplitudes accordingly: first (0Hz, 1), second (250Hz, 1). Value of a weight, given in last (4-th) node, if a frequency rate, appropriate to it is less Nyquist rate (500/dt a Hz, where dt - step of digitization traces in ms), starts to stationary values on a length from this frequency rate up to Nyquist rate.
After pressing the button OK in this panel the window of visualization of spectra Visual Spectrum Process with fields for average and current of spectrums
is opened and program passes in the mode of on-line choice a trace for subsequent on-linen definition of the operator of the bandpass filter.
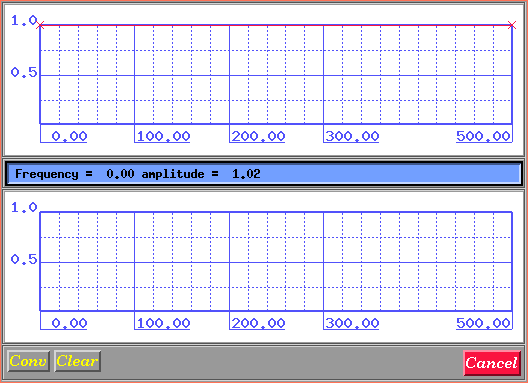
Further it is necessary to the user in a field of visualization of
traces to select traces, on spectra which the weight function will be set.
The selection of a trace is carried out with the help of single click of the
left button of the mouse above the necessary trace, then the given trace in a
field of visualization of traces will be marked by a green line. In the
bottom part of a field of visualization of a spectrum the amplitude
spectrum of the given trace (red graph), and in the top part of a field - total
stacked amplitude spectrum of all already selected traces (green graph) will be
deduced. If necessary of selection at once of several traces ought to press the
left key of the mouse and to move the cursor on the necessary quantity of
traces.
Now user can proceed to the direct setting of the form of weight function (filter). By default weight function represents red line and is given by its values in four nodes in the panel Band-Pass Filter Parameters.
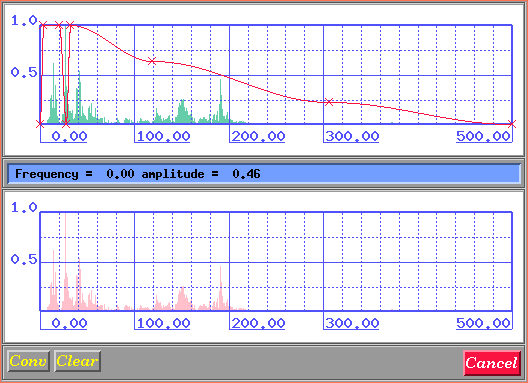
After the setting of weight function it is necessary to start process of filtration, having pressed the button "Conv" in the bottom part of a visualization window of spectrum. Thus the window will appear, in which it will be offered to the user enter output modification name (name should to begin on ' S and to come to an end by anyone in three figures, for example, " S999 ") and to set a type of the used filter: 0 - zero - phase, 1- minimum - phase,
then it is necessary to press the button "GO". The filtration action will begin, the progress-indicator works, while the filtration action will not be completed. By pressing of the button Cancel it is possible to abort this process.
The note: at work in a visualization window of a spectrum the increase
of scales of the represented spectra can be required. In view of absence of the
built - means of scaling it is possible simply to increase the sizes of a
window, the graph of a total spectrum thus will be scaled proportional.
File
View
Filter
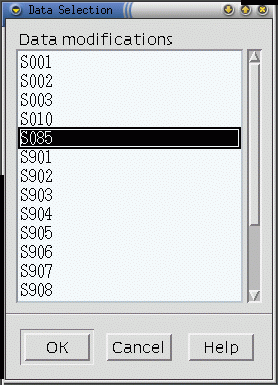
It is necessary to select from it modification and to press the button ??. The selected modification will be drawn in a field of traces. The previous modifications closed. The area and visualization mode of the closed modifications is remembered.
In this dialogue it is possible to change:
The given window consists of four components:
In this the field weight function of the filter is set. For the
definition of the site of weight function it is necessary to click the left
button of the mouse above the green graph. The quantity of sites should be
less than 50. For removal of the node it is necessary to click the right
button of the mouse above the necessary node. At attempt to set the node
outside of a coordinate grid, the coordinates of the node automatically
accept the maximal or minimal values. (For example for the setting of the
site with coordinates 0-amplitude, 0-frequency is possible simply to click
the mouse below and more to the left of coordinate grid.)
By default in it field the characteristic of filter, determined numerical parameters of its nodes in the window Band-Pass Filter Parameters is preselected.
Moving the cursor of the mouse in a field Average Spectrum we
select a position of the current node of weight function. At moving the
cursor in the information line under this field the value of frequency
(Frequency) and amplitude (amplitude) of weight function for the current
position of the cursor is shown. Selecting a position of a node visually or
on values in an information line it is necessary to press the left key of
the mouse. On the screen by dagger the given node will be designated. In a
line of the information the values of its frequency and amplitudes will be
displayed. All nodes set to this moment, will be connected by a continuous
line. The setting of a node can be cancelled, having moved to it the cursor
and having pressed the right key of the mouse. It is necessary to have in
view of, that it is impossible to remove the first and last nodes of weight
function of the filter having values of frequencies 0 Hz and 500/dt Hz
accordingly, where dt - discretization step of trace in ms. It is possible to change only values of their amplitudes. To frequencies superior a frequency rate of the last node the value of amplitude in this point is assigned. The ruler of tools is situated under area of traces visualization and has
the following kind:
To the left of vertical feature the buttons of actions are located: at click
1-st button of the mouse occurs any action duplicating the appropriate the menu
item. More to the right of vertical feature the buttons of modes of operations
by the mouse on a field of traces are located. An each concrete moment one of
modes is active only. The button of this mode is led round in such case by a red
framework. To change the current mode of operations it is possible having
clicked 1-st button of the mouse on an icon of the appropriate mode or from the
menu. By most right the red button of an exit from the program settles down.
The program loads one modification SCS-5, consisting from two files: the
tables of modification(the name looks like Mxxx.tab) and file of the
data (the name looks like Yxxx.dat), where xxx - three symbols
of a unique code of modifications necessarily conciding in both names, and
Y - one of the letters S, R, D, designating a kind of sorting
CDP (the data VSP as a rule has sorting such as S). The modification
should has a type of a structure VSP and type of the data distinct from
parametrical, differently it will not be loaded.
The program does not require ordering input traces, can process as
one-component, and multicomponent traces.
The output traces is written in a format R4, i.e. everyone the temporary
readout of a body of a trace occupies 4 bytes. The name of a output file should
look like Sxxx.dat), where xxx - three symbols of a unique
code of modification.
The current catalogue (from which the program is started) must contain a file
.sdscolor, in which the colours used by the program are registered and
a file setup in which the variable environments are registered.
User interface
Menu structure
Help
Menu items

by mouse coursor.


 The given button calls dialogue of the setting of output modification and the
filter type.
  The given button cancels all selected
traces in a window of a field of visualization of traces, clears
visualization fields of spectra and will transform weight function to an
initial kind.
  The given button closes a
visualization window of spectra, but selection of traces, their spectra
and form of weight function are remembered.
 Ruler of tools.

 View - >Options...
 View - > Undo
 View - > Redo
 View - > Zoom all
 View - > Info mode
 View - > Zoom in
 View - > Zoom out
 Filter
 File - > Exit
Input data
Traces
Output data
Traces
Requirements to the environment
Used files
Messages to the user
Way of finishing of the messages up to the user